상황
- Actuactor -> Promethus -> Grafana 구조를 구현하려고 한다
- 자바 백엔드 서버는 로컬 서버
loacalhot:3000에서 실행하고 있다 - Prometheus는 docker 인스턴스
:9090포트로 띄우고 있다 - Grafana도 docker 인스턴스
:80포트로 띄우고 있다 - 아래 블로그 글을 참고했으나 버전이 바뀌어 맞지 않는 부분이 있다
- 그래서 Grafana에서 대시보드를 띄워도 "No Data" 에러가 발생한다. Application도 읽지 못 한다
해결법
prometheus.yml
scrape_configs:
  - job_name: 'prometheus'
    static_configs:
      - targets: [ 'host.docker.internal:8080' ]
metrics_path: '/actuator/prometheus'바뀌는 부분은 host.docker.internal과 scrape_configs.metrics_path 이다
host.docker.internal로 적는 이유는 그것이 도커 바깥에서 실행 중인 로컬 서버의 ip이기 때문이다. localhost로 적으면 도커 인스턴스 자신을 참조하게 되어 우리가 도커 밖에서 띄운 로컬 서버를 참조하지 못한다
metrics_path는 문법이 scrape_configs 하위로 바뀌었다. Prometheus 공식 문서를 참고하여 작성하였다.
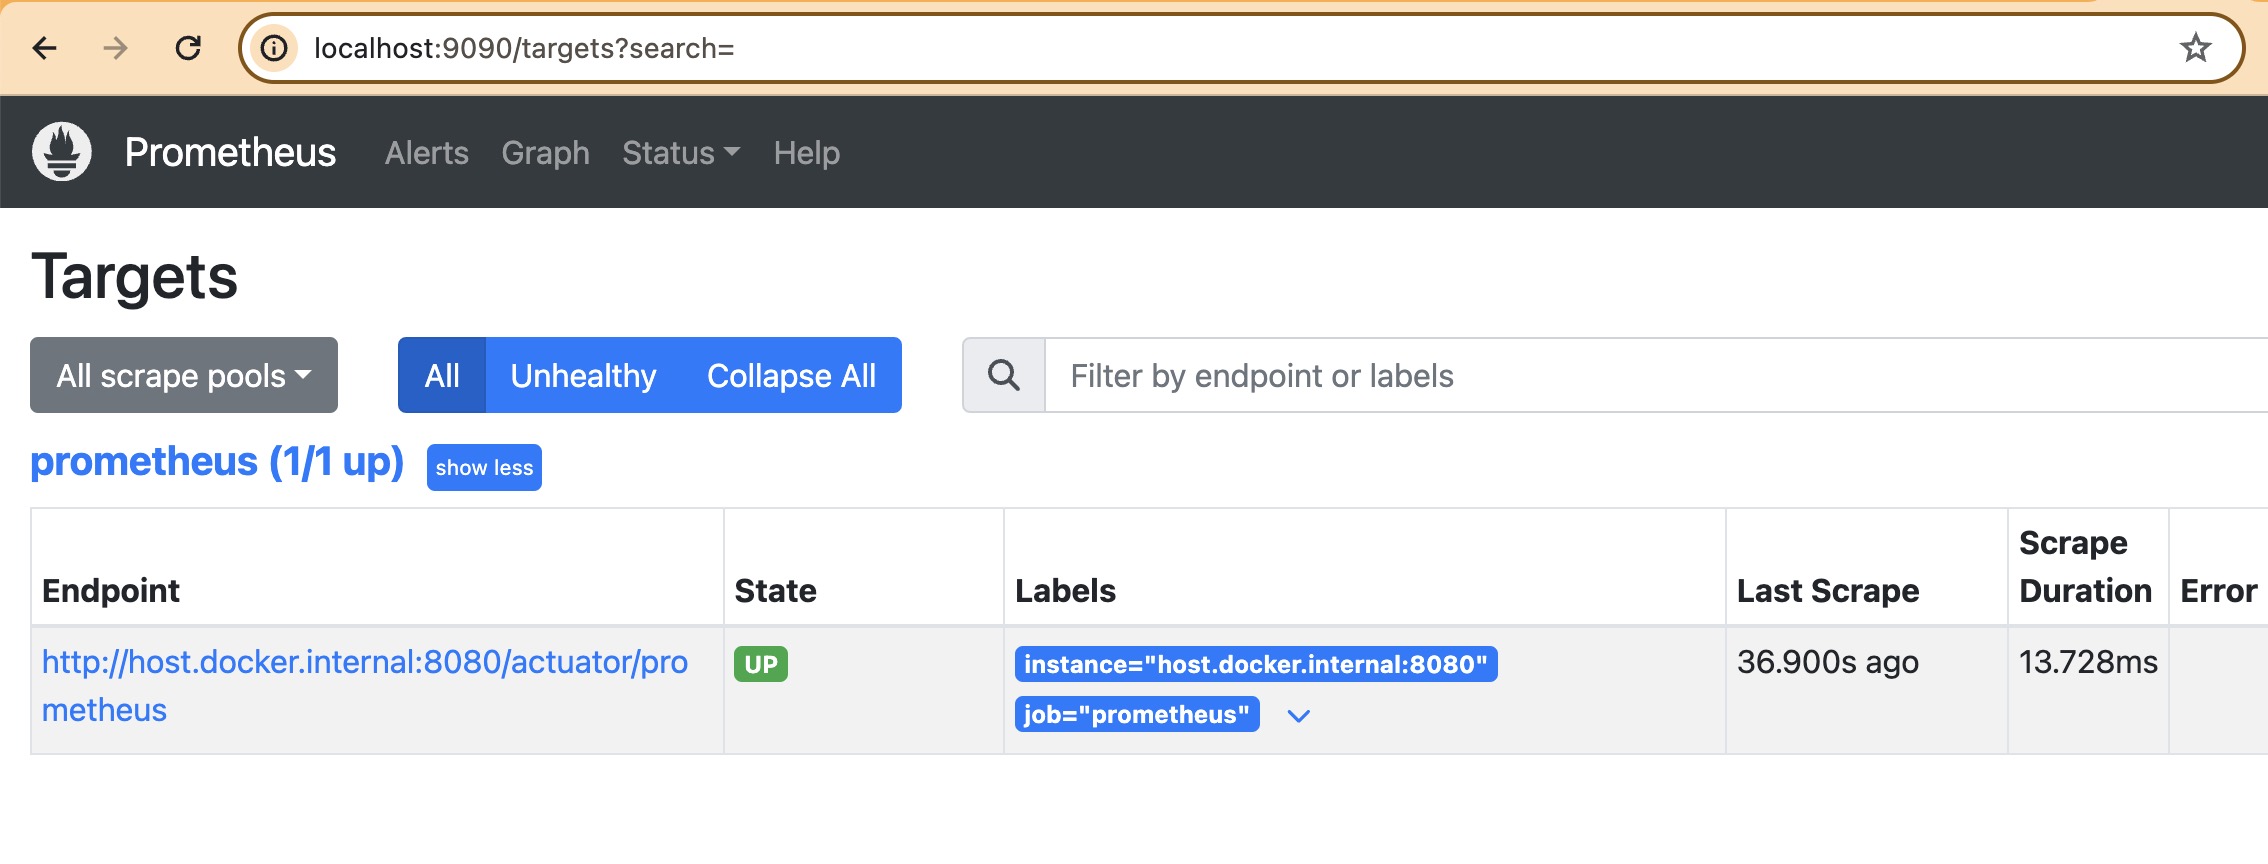
위 yml을 이용해서 Prometheus를 실행한 후 Status - Targets에서 endpoint에 State가 UP으로 잘 연결되었는 지 확인한다.

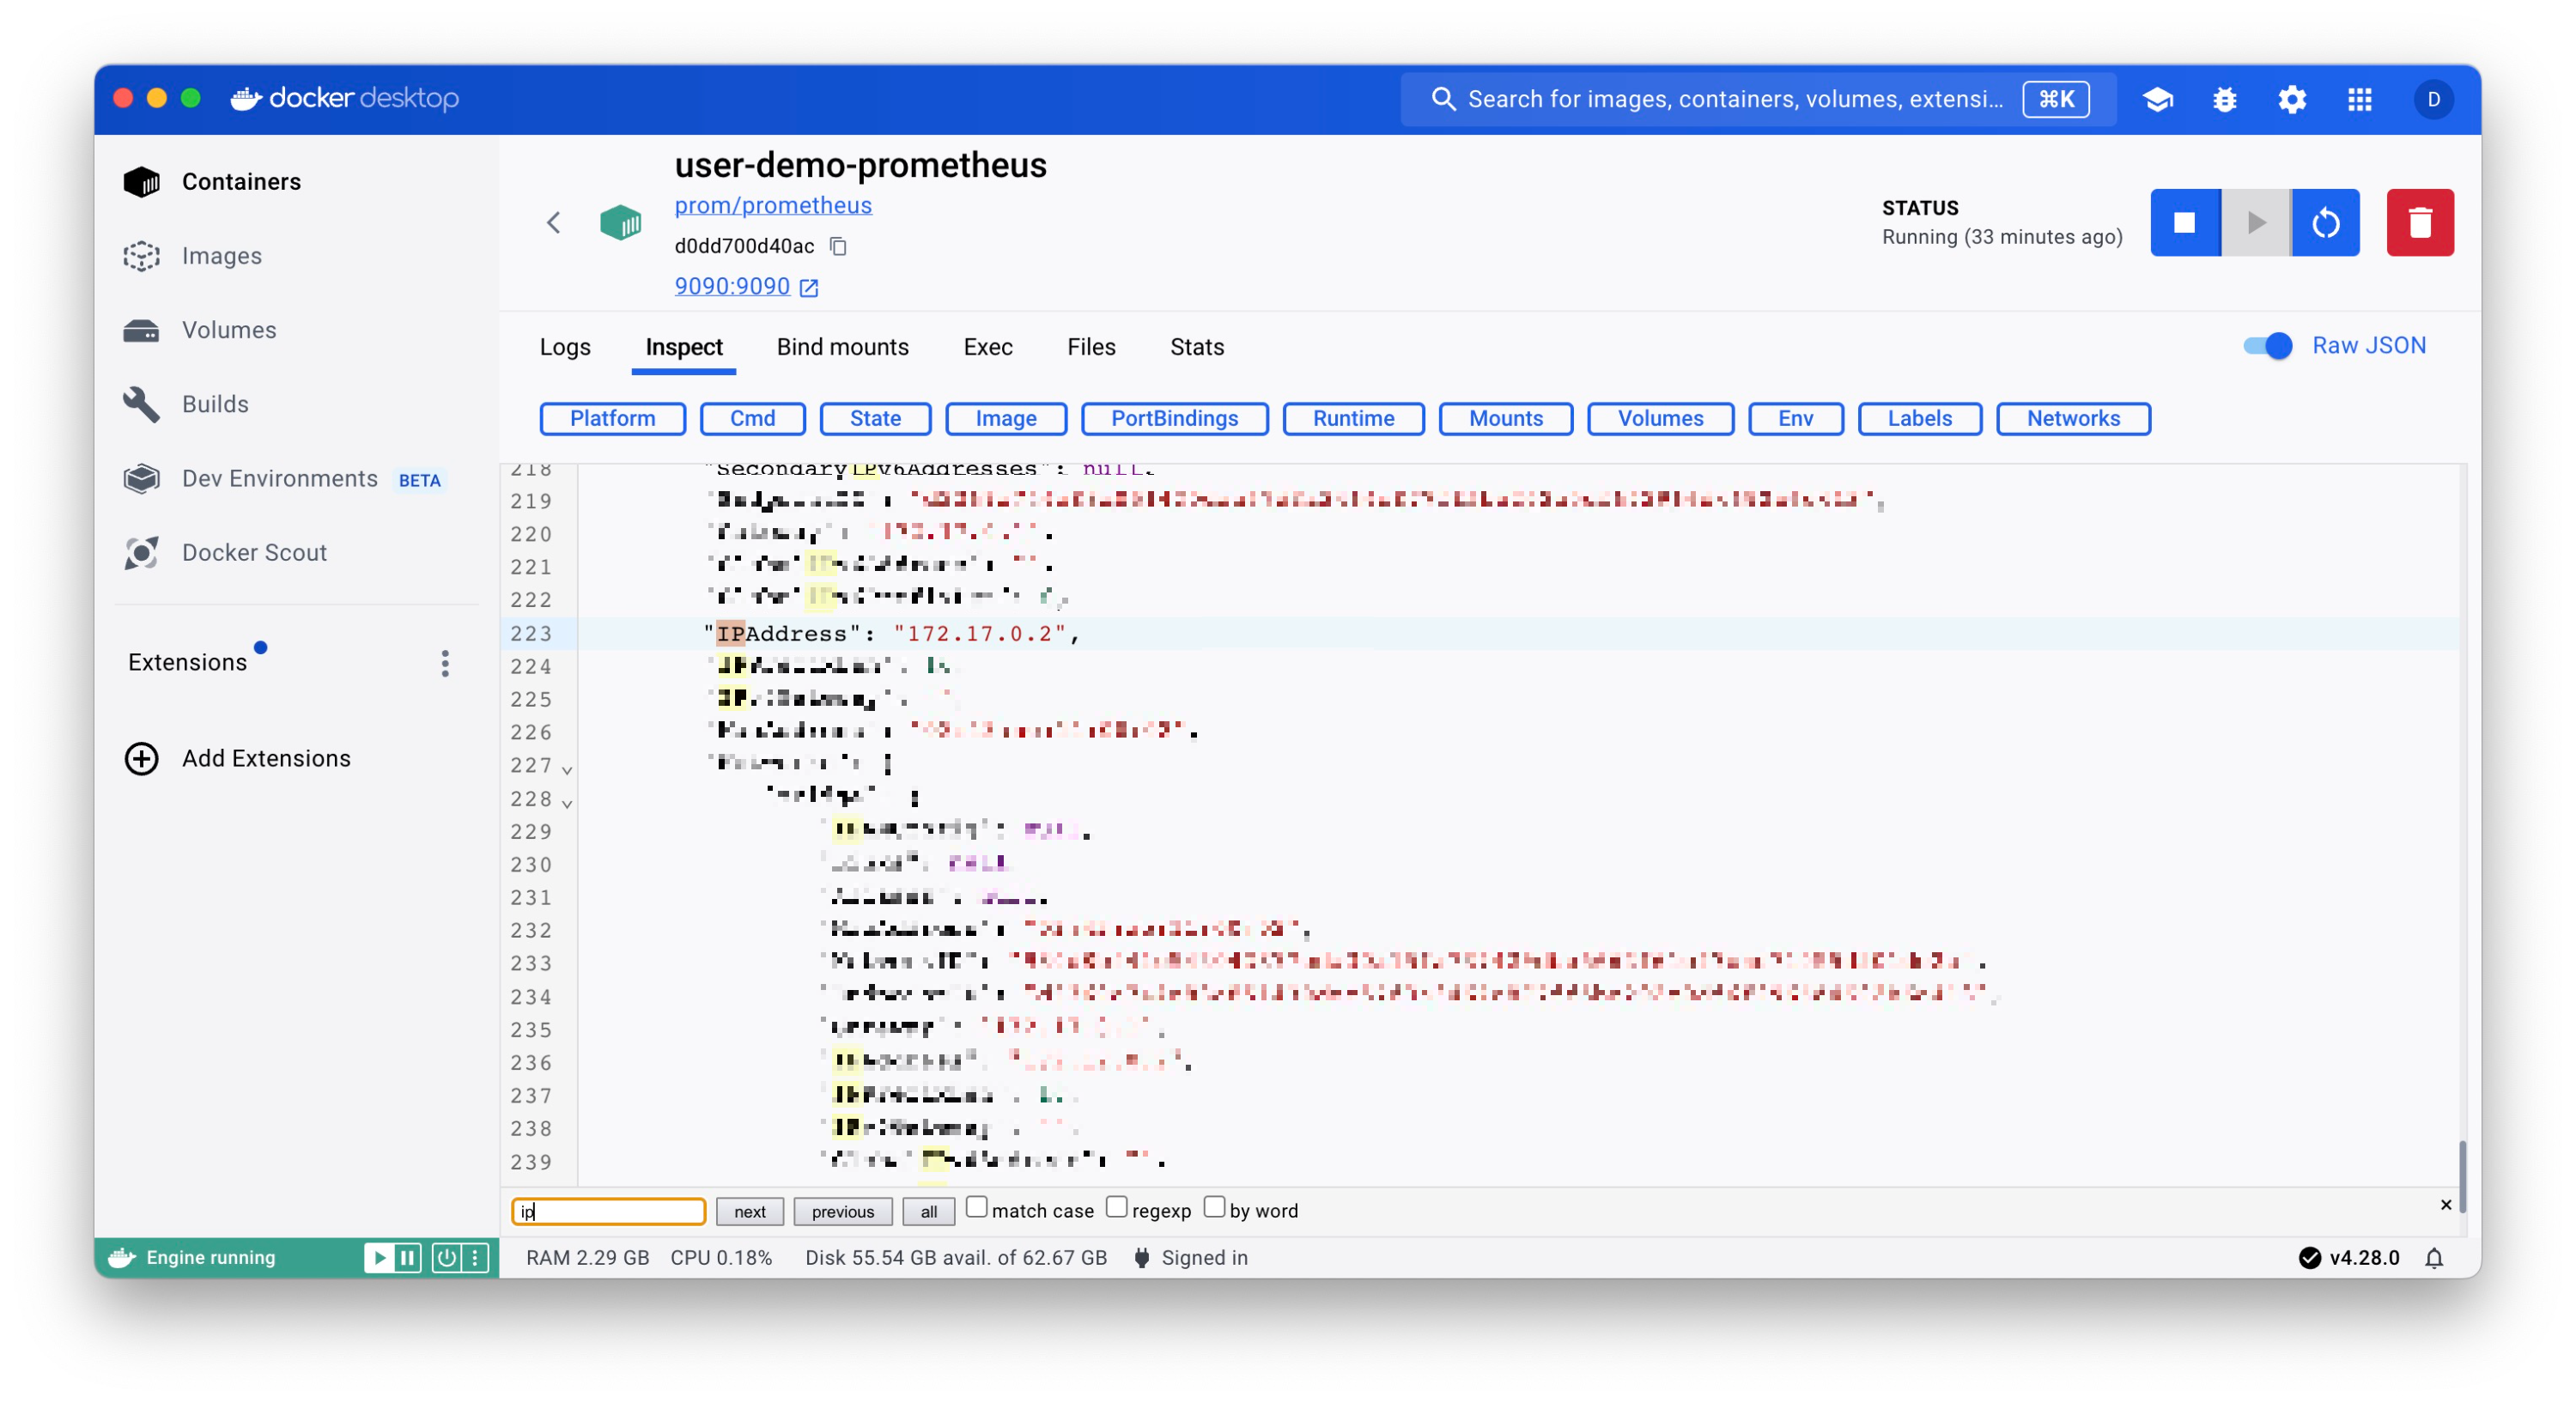
Grafana connection 주소 부분에는 Prometheus 도커 인스턴스의 IP (사설 IP)를 입력한다
추가로, 본 포스팅에서는 JVM (Micrometer) 대시보드를 import했기 때문에 문서에 나온 대로 application.yml에 application name을 추가해 주었다.
application.yml
spring:
  application:
    name: spring-user-demo

...
management:
  metrics:
    tags:
      application: ${spring.application.name}
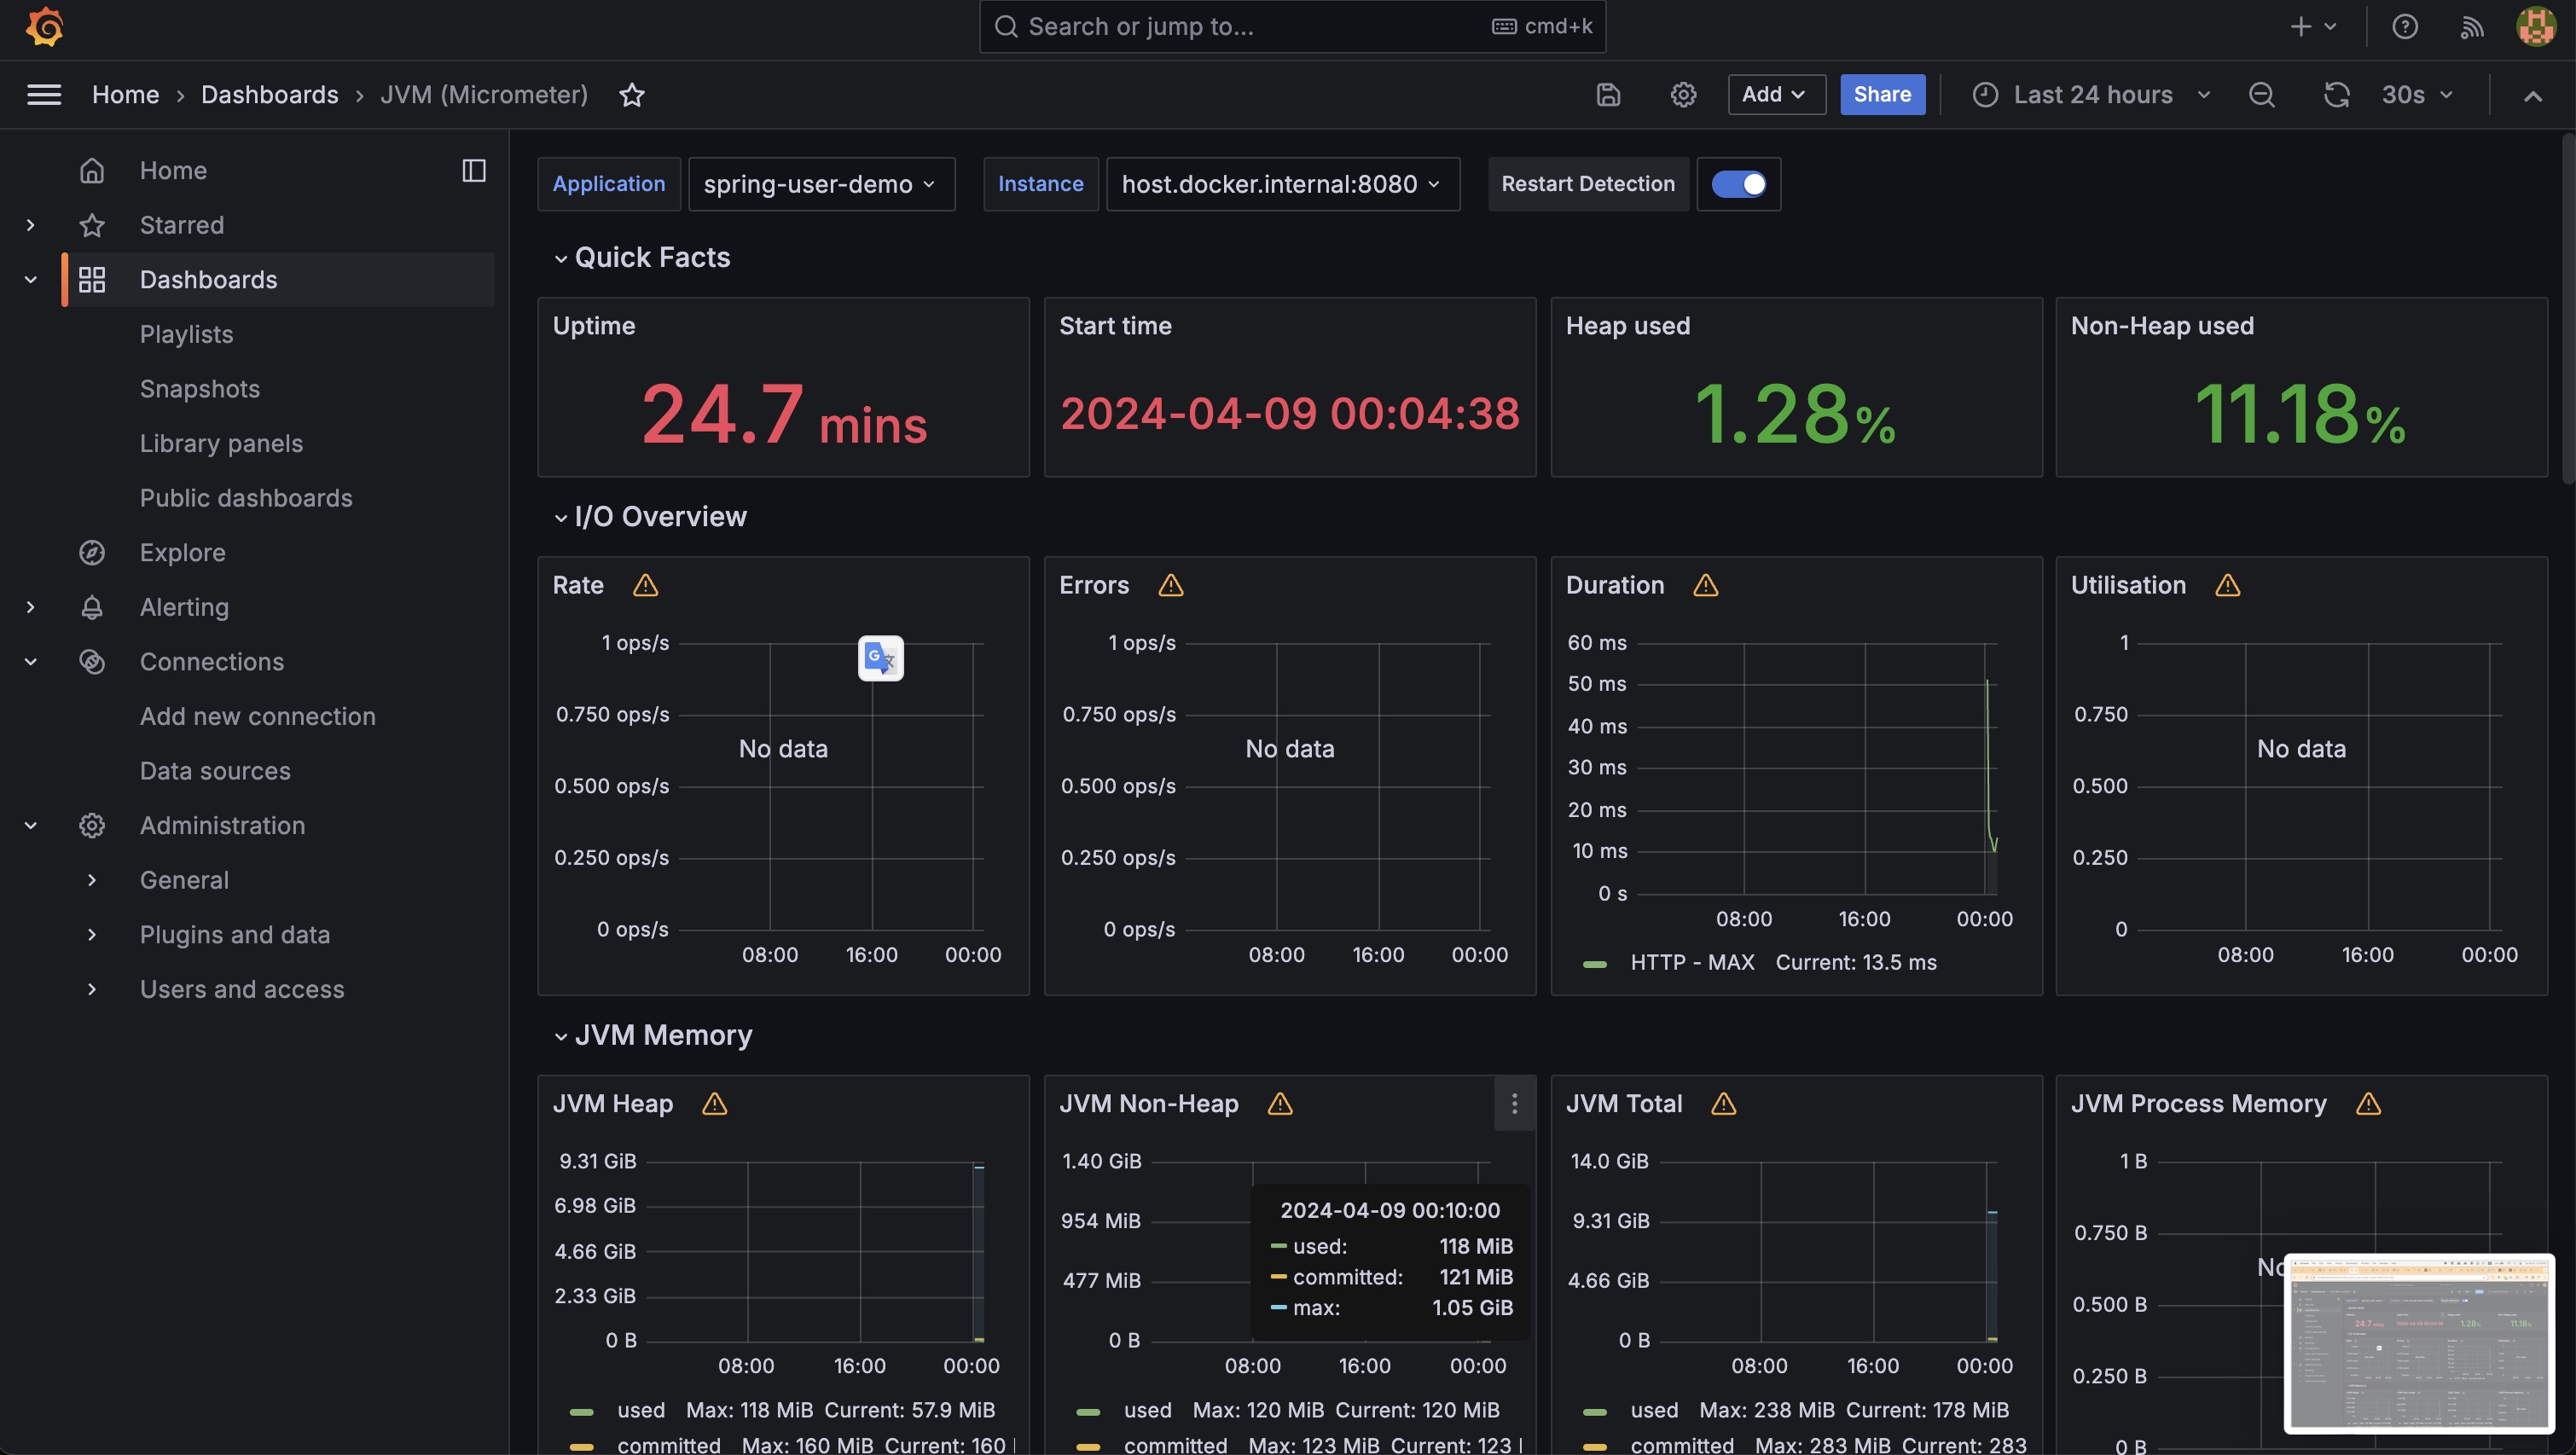
실행 결과 Grafana에서 서버의 정보를 잘 읽어 오는 것을 확인할 수 있다
출처
https://hudi.blog/spring-boot-actuator-prometheus-grafana-set-up/
'Spring Framework' 카테고리의 다른 글
| 좋은 객체 지향 프로그래밍이란? - 다형성 (0) | 2024.05.23 |
|---|---|
| [Spring] 동시에 발생한 요청을 처리하는 방법 - Multithreading (0) | 2024.04.26 |
| [Spring][스크랩] Spring Boot Actuator, Prometheus, Grafana를 사용한 모니터링 환경 구축 (0) | 2024.04.08 |
| [Spring][Fix] Spring Boot Actuator - /info에 application 속성 나오지 않을 때 (0) | 2024.04.08 |
| [Spring][스크랩] Spring Boot 공식 문서 (0) | 2024.04.08 |
상황
- Actuactor -> Promethus -> Grafana 구조를 구현하려고 한다
- 자바 백엔드 서버는 로컬 서버
loacalhot:3000에서 실행하고 있다 - Prometheus는 docker 인스턴스
:9090포트로 띄우고 있다 - Grafana도 docker 인스턴스
:80포트로 띄우고 있다 - 아래 블로그 글을 참고했으나 버전이 바뀌어 맞지 않는 부분이 있다
- 그래서 Grafana에서 대시보드를 띄워도 "No Data" 에러가 발생한다. Application도 읽지 못 한다
해결법
prometheus.yml
scrape_configs:
  - job_name: 'prometheus'
    static_configs:
      - targets: [ 'host.docker.internal:8080' ]
    metrics_path: '/actuator/prometheus'
바뀌는 부분은 host.docker.internal과 scrape_configs.metrics_path 이다
host.docker.internal로 적는 이유는 그것이 도커 바깥에서 실행 중인 로컬 서버의 ip이기 때문이다. localhost로 적으면 도커 인스턴스 자신을 참조하게 되어 우리가 도커 밖에서 띄운 로컬 서버를 참조하지 못한다
metrics_path는 문법이 scrape_configs 하위로 바뀌었다. Prometheus 공식 문서를 참고하여 작성하였다.
위 yml을 이용해서 Prometheus를 실행한 후 Status - Targets에서 endpoint에 State가 UP으로 잘 연결되었는 지 확인한다.
Grafana connection 주소 부분에는 Prometheus 도커 인스턴스의 IP (사설 IP)를 입력한다
추가로, 본 포스팅에서는 JVM (Micrometer) 대시보드를 import했기 때문에 문서에 나온 대로 application.yml에 application name을 추가해 주었다.
application.yml
spring:
  application:
    name: spring-user-demo

...
management:
  metrics:
    tags:
      application: ${spring.application.name}
실행 결과 Grafana에서 서버의 정보를 잘 읽어 오는 것을 확인할 수 있다
출처
https://hudi.blog/spring-boot-actuator-prometheus-grafana-set-up/
'Spring Framework' 카테고리의 다른 글
| 좋은 객체 지향 프로그래밍이란? - 다형성 (0) | 2024.05.23 |
|---|---|
| [Spring] 동시에 발생한 요청을 처리하는 방법 - Multithreading (0) | 2024.04.26 |
| [Spring][스크랩] Spring Boot Actuator, Prometheus, Grafana를 사용한 모니터링 환경 구축 (0) | 2024.04.08 |
| [Spring][Fix] Spring Boot Actuator - /info에 application 속성 나오지 않을 때 (0) | 2024.04.08 |
| [Spring][스크랩] Spring Boot 공식 문서 (0) | 2024.04.08 |